Data analyst
An 8-step data analysis roadmap: framing business questions and basic statistics, advanced Excel and Google Sheets, SQL, data cleaning with Python pandas, visualization in Power BI or Looker Studio, storytelling with data, and a real analysis project. Afterwards you can work as a data analyst or reporting specialist in businesses, banks or retail. Suits people who like numbers and asking why.
Start here
Step 1: Analytical thinking & basic statistics
One short lesson per step, 10–15 minutes on a phone. No sign-up needed.
Hands-on roadmap
Roadmap
- Step 1Lesson
Analytical thinking & basic statistics
Framing measurable business questions and KPIs; mean, median, distributions, correlation versus causation; sampling bias; protecting customers' personal data during analysis.
- Step 2Skill
Advanced Excel & Google Sheets
XLOOKUP, SUMIFS, Pivot Tables, Power Query to merge and clean files; tidy data formats; common pitfalls: wrong date formats, numbers stored as text, duplicate rows.
Requires: Analytical thinking & basic statistics
No English content for this step yet.
- Step 3Skill
SQL querying & aggregation
SELECT, WHERE, GROUP BY, JOINs, subqueries, CTEs, window functions; querying PostgreSQL, MySQL or BigQuery; cross-checking totals to avoid JOINs that duplicate rows.
Requires: Advanced Excel & Google Sheets
No English content for this step yet.
- Step 4Skill
Python pandas for cleaning & analysis
Jupyter or Google Colab; reading CSV and Excel, handling missing data, standardizing province names, merging and grouping tables; quick charts with matplotlib and seaborn.
Requires: SQL querying & aggregation
No English content for this step yet.
- Step 5Skill
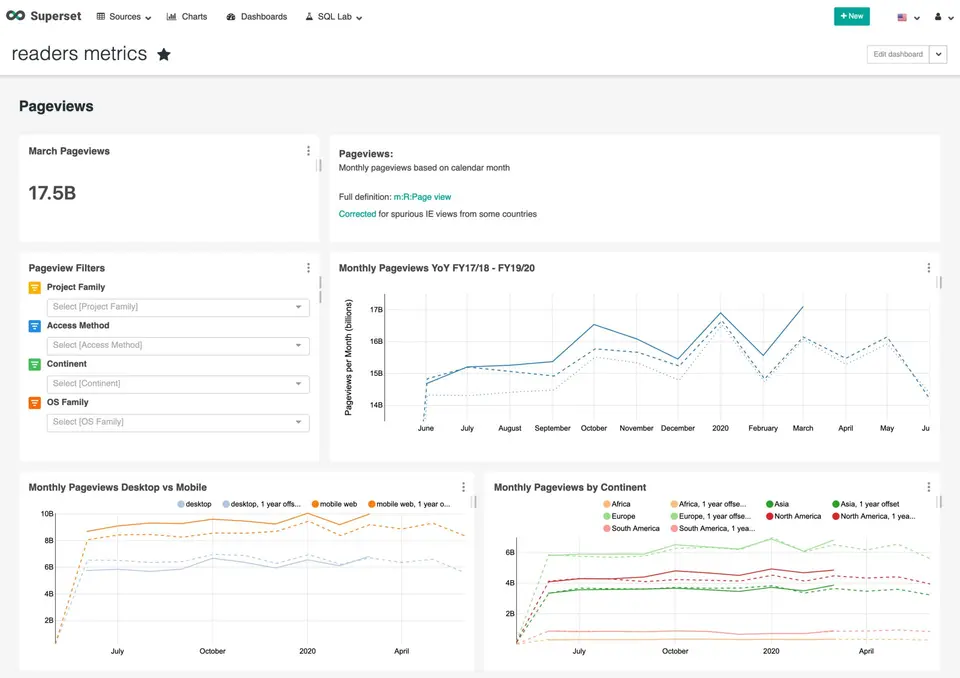
Dashboards in Power BI or Looker Studio
Star schema models, basic DAX, filters, choosing the right chart; one-page dashboards for managers; scheduled data refresh and view permissions.
Requires: Python pandas for cleaning & analysis
No English content for this step yet.
- Step 6Skill
Data storytelling & actionable recommendations
Presentation structure: context, findings, recommendations; cohort, funnel and basic A/B test analysis; presenting to non-experts and avoiding misleading charts.
Requires: Dashboards in Power BI or Looker Studio
No English content for this step yet.
- Step 7Project
Project: retail chain sales analysis
Use a public or anonymized sales dataset: clean it in Python, query with SQL, build a Power BI dashboard, report 5 findings and 3 recommendations; publish on GitHub and a portfolio page.
Requires: Data storytelling & actionable recommendations
No English content for this step yet.
- Step 8Assessment
SQL and Excel tests & case interviews
Practice timed SQL and Excel tests that employers often give, plus business case analyses; a CV with portfolio and applications via TopCV and LinkedIn.
Requires: Project: retail chain sales analysis
No English content for this step yet.