A data analyst is the person who turns a company's sales, customer and operations data into clear answers to questions such as "why did revenue drop this month?" or "which products should we stock more of?". Their everyday tools are Excel, SQL, Python and a dashboard tool such as Power BI. This lesson explains what a data analyst does each day, how the role differs from a data scientist or data engineer, which skills to learn, a 6-month plan for beginners, and reference salaries in Vietnam for 2026.
By the end of this lesson, you will be able to:
- Explain what a data analyst is and describe a typical working day in 5 tasks.
- Tell a data analyst apart from a data scientist, a BI developer and a data engineer using a comparison table.
- Read and understand an SQL query that totals revenue by product category.
- Redo the worked example of a shop's sales analysis yourself: totals, shares and changes that all add up.
- Plan a 6-month path (26 weeks, about 390 hours) to reach fresher-application level.
Want to learn in the right order? The Data analyst roadmap on NAMBIN has 8 steps: analytical thinking, advanced Excel, SQL, Python pandas, dashboards, data storytelling, a real project and employer tests. See the 8-step data analyst roadmap.
Quick answer: what is a data analyst?
A data analyst is the bridge between raw data and the people who make decisions. A sales director has no time to read 50,000 order lines; they need one sentence: "Revenue fell 4%, mostly because of drinks, so cut soft-drink orders and push hot drinks." The data analyst is the person who finds that sentence and backs it up with numbers.
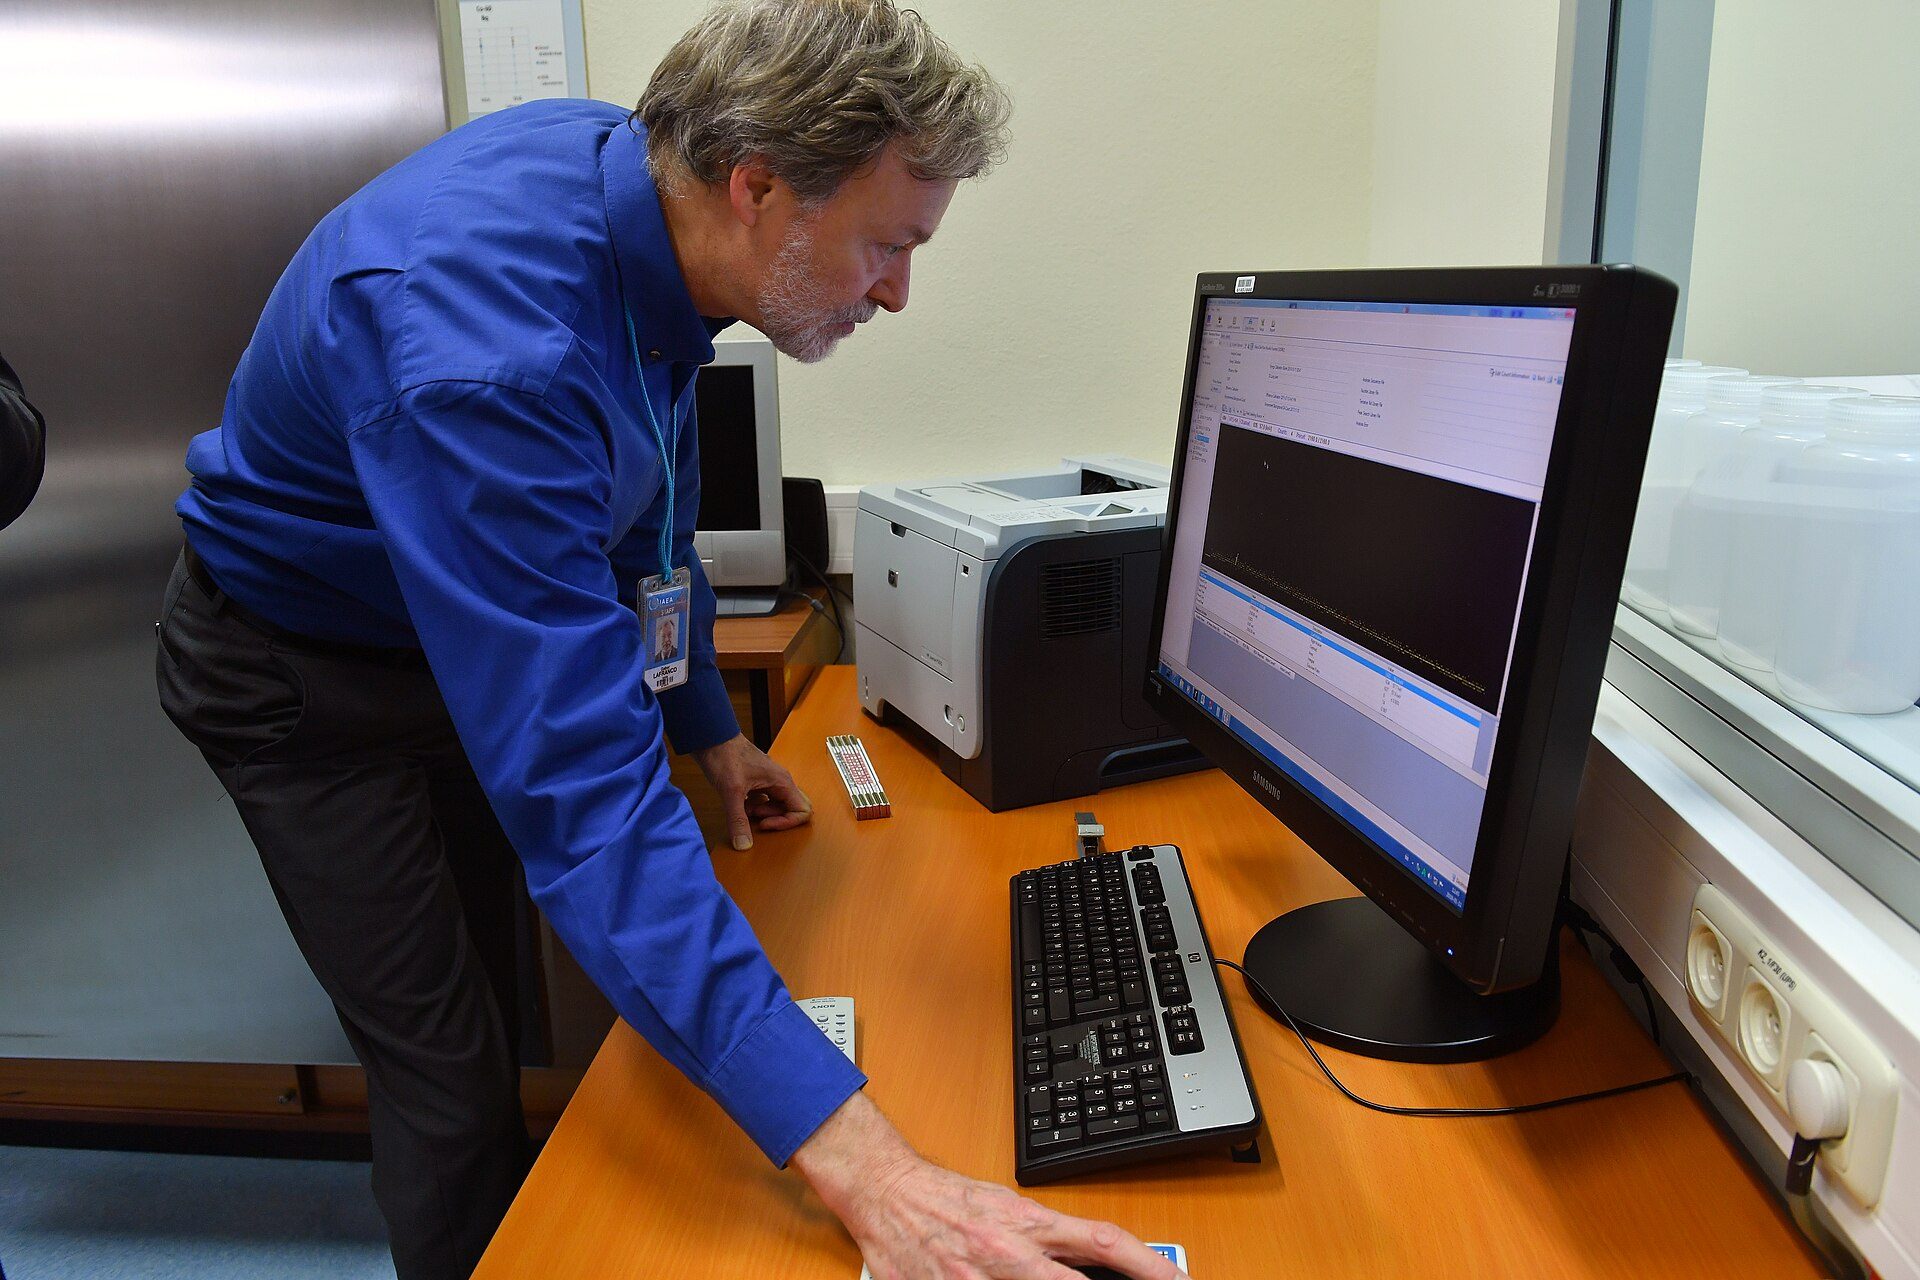
Photo: IAEA Imagebank / Wikimedia Commons, CC BY 2.0
Three kinds of question a data analyst answers
- What happened? What were last week's revenue, customer count and cancellation rate (descriptive analysis).
- Why did it happen? Did revenue fall because there were fewer customers or because each spent less; which category, which branch (diagnostic analysis).
- What should we do next? Recommend actions backed by numbers, such as changing promotion hours or dropping slow-selling items.
Why Vietnamese businesses need this role
Today even a small shop uses point-of-sale software, e-commerce marketplaces and Facebook ads — all of which generate data. Banks, retail chains and logistics companies handle millions of transactions a month. There is plenty of data, but few people who know how to ask the right question and read the numbers correctly.
A day in the life of a data analyst
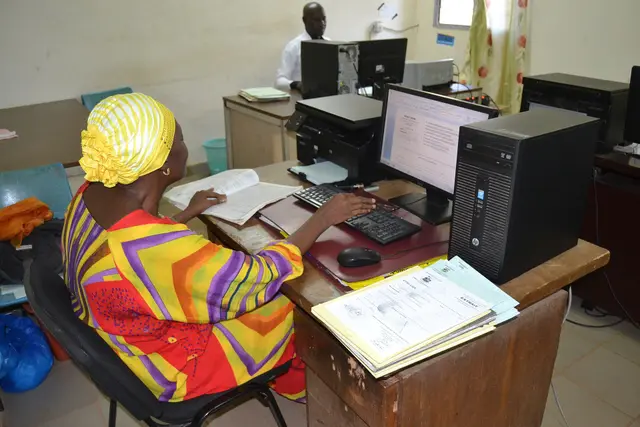
The work varies by industry, but the rhythm at a retail or e-commerce company is fairly similar. Most of the time is spent at a computer in an office like the one in Figure 2, broken up by meetings with other departments.

Photo: Missionedit / Wikimedia Commons, CC BY-SA 4.0
Morning: check the numbers and dashboards
Open the dashboard (a page of charts and indicators that update automatically) and look for anything unusual in yesterday's revenue and orders. If a number drops suddenly, the first job is to check whether data is missing or a sync has failed — before raising the alarm with the boss.
Midday: take questions and answer them
Marketing asks "how many new customers did last week's campaign bring in?"; purchasing asks "which items have been in stock for more than 60 days?". The analyst clarifies the question, writes SQL to pull the data, cleans it in Excel or Python, and answers with a short table or chart.
End of week and month: reports and presentations
Compile regular reports and present findings and recommendations in meetings. This part needs speaking and writing skills: the audience is usually not numbers people, so each chart should answer exactly one question.
How is a data analyst different from a data scientist, BI developer or data engineer?
These four job titles are often mixed up in job ads. The table compares them the way Vietnamese companies typically split the work; in a small company one person may cover two roles.
| Role | Main question | Typical tools | Output |
|---|---|---|---|
| Data analyst | What happened, why, and what to do | Excel, SQL, Python, Power BI | Reports, analyses, recommendations |
| BI developer / BI analyst | How can everyone see the numbers themselves every day | SQL, Power BI, Looker Studio, data models | Dashboards, automated reporting systems |
| Data scientist | What will happen next, and how to predict it | Python, statistics, machine learning | Forecasting models, product recommendations |
| Data engineer | Where data flows from and to, and is it clean and on time | SQL, Python, ETL tools, data warehouses, cloud | Data pipelines, data warehouses |
Which role should you start with?
Data analyst is the easiest way in: the maths is basic statistics, the programming is moderate, and there are many "reporting specialist" jobs for beginners. Data scientists usually need deeper maths and machine learning; data engineers need stronger programming and systems skills.
Where the career can go later
After 2–3 years as an analyst, many people take one of three paths: specialise in a domain (marketing, finance, supply chain), move into BI or data engineering, or learn machine learning to become a data scientist.
Skills you need: Excel, SQL, Python, Power BI
Learn these four tools in this order: each one handles work the previous one does slowly or cannot do at all. The shared foundation is basic statistical thinking: mean, median, distribution, and knowing that two things rising together does not mean one causes the other.
Excel and Google Sheets
Still the most widely used tool in Vietnamese businesses. You need to be fluent in XLOOKUP, SUMIFS, Pivot Tables, correct date formats, and spotting numbers stored as text and duplicate rows. Excel suits data of a few tens of thousands of rows; beyond that it becomes slow and error-prone.
SQL: pulling data from databases
SQL is the language for asking questions of a database. Almost every data analyst hiring test includes SQL. Here is a sample query that calculates October 2026 revenue by product category, sorted from highest to lowest.
SELECT category,
       SUM(quantity * unit_price) AS revenue
FROM orders
WHERE sale_date >= '2026-10-01'
  AND sale_date < '2026-11-01'
GROUP BY category
ORDER BY revenue DESC;
Line by line: take the category column and the sum of (quantity × unit price), named revenue; from the orders table; only orders from 1 October up to but not including 1 November; group by category; sort in descending order. Using "before 1 November" instead of "up to 31 October" avoids missing orders placed during the day on the 31st.
Python with the pandas library
Python helps you clean and merge large datasets and repeat the same process every week without manual clicking. For example: merging 12 Excel files from 12 branches and standardising "TP.HCM", "Ho Chi Minh" and "HCM" into one name. Beginners usually start with Google Colab or Jupyter, running Python in the browser or in a terminal window as in Figure 3.

Photo: 9002Jack / Wikimedia Commons, CC0
Power BI or Looker Studio: dashboards
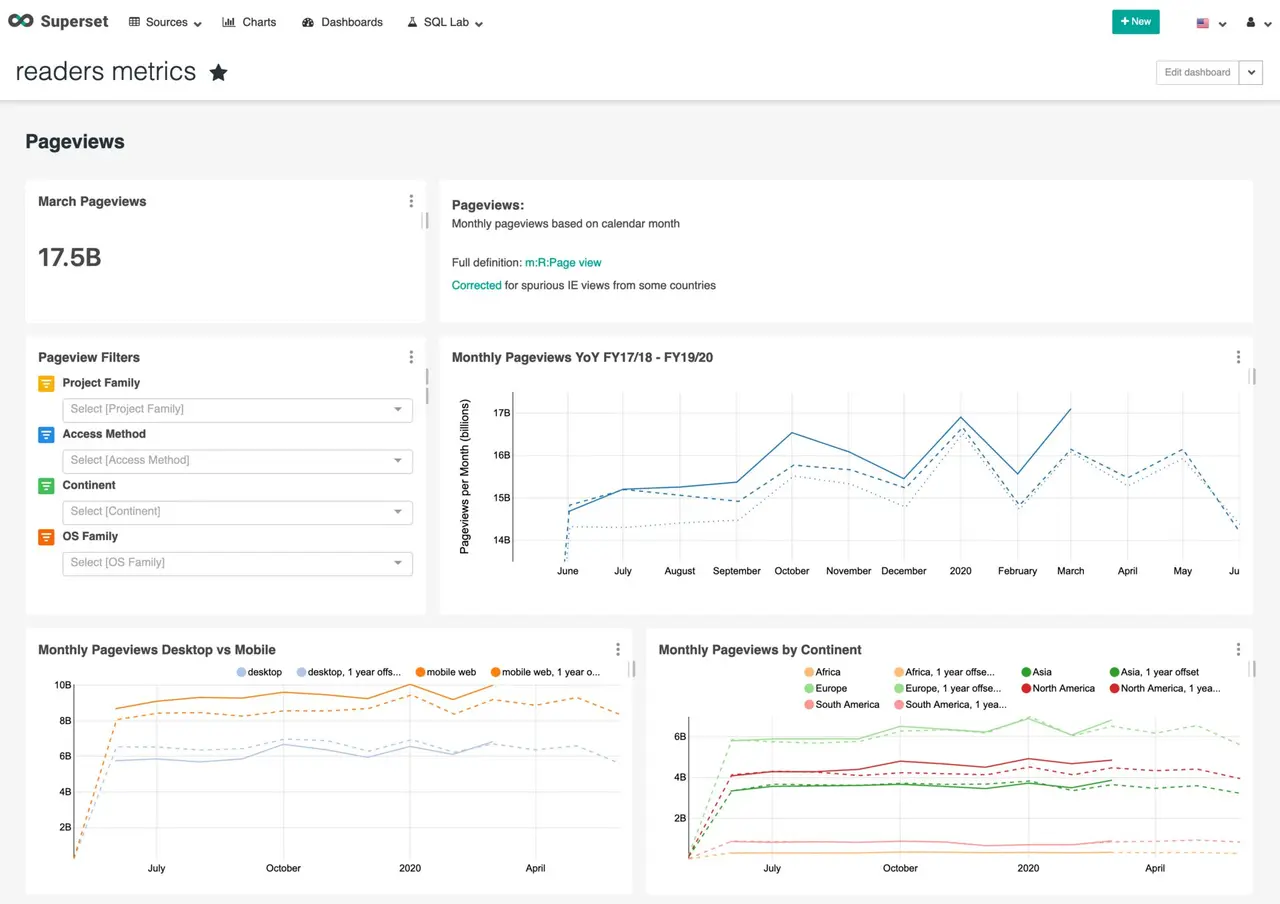
A dashboard puts the key indicators on one page and refreshes them daily. Power BI is common in companies that use the Microsoft ecosystem; Looker Studio is free and suits Google data; there are also open-source tools such as Apache Superset (Figure 4). The rules for choosing charts are the same everywhere: use bars to compare, lines for trends over time, and pie charts only for shares of a few groups.
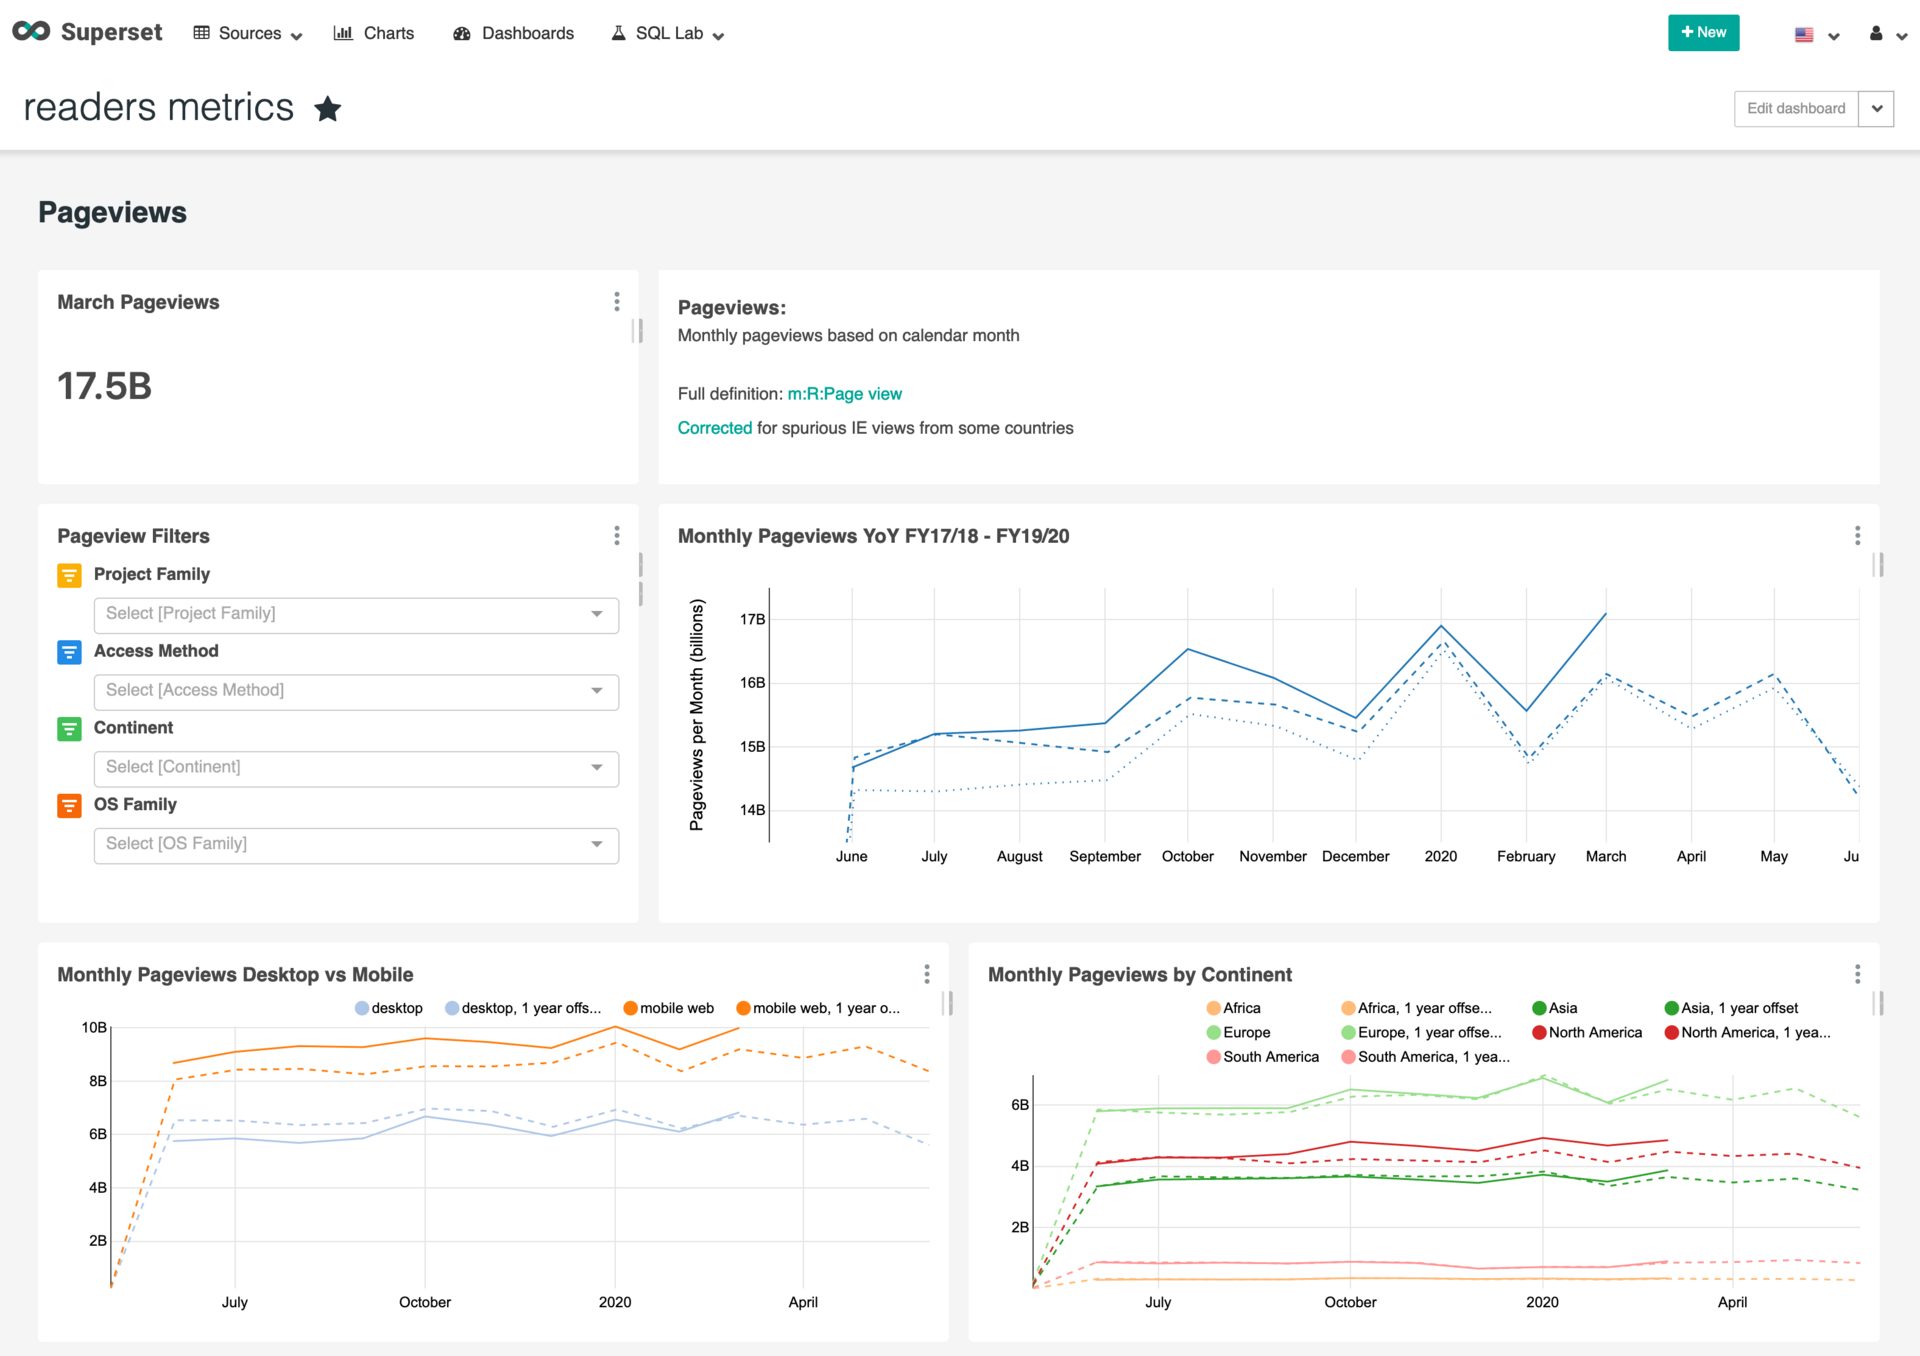
Photo: MPopov (WMF) / Wikimedia Commons, CC BY-SA 4.0
Worked example: analysing sales at a neighbourhood grocery shop
Ms Hanh runs a grocery shop in Hanoi (similar to Figure 5) and uses point-of-sale software, so she has data for every order. She notices that October 2026 revenue was lower than September and asks: "Why did it fall, and what should I do in November?". The figures below are illustrative.

Photo: Vuong Tri Binh / Wikimedia Commons, CC BY-SA 4.0
Step 1: total revenue by category
Running the SQL query above for September and October gives this table (million VND; 1 million VND is roughly 40 USD):
| Category | September | October | Change | % change | Share in October |
|---|---|---|---|---|---|
| Drinks | 54 | 48 | −6 | −11.1% | 40.0% |
| Noodles, rice, dry goods | 35 | 36 | +1 | +2.9% | 30.0% |
| Snacks and sweets | 20 | 22 | +2 | +10.0% | 18.3% |
| Toiletries and household | 16 | 14 | −2 | −12.5% | 11.7% |
| Total | 125 | 120 | −5 | −4.0% | 100% |
Checking the sums: September is 54 + 35 + 20 + 16 = 125; October is 48 + 36 + 22 + 14 = 120; the changes −6 + 1 + 2 − 2 = −5, exactly 120 − 125. The shares 40.0 + 30.0 + 18.3 + 11.7 = 100%.
Step 2: fewer customers, or smaller baskets?
Revenue = number of orders × average order value. September had 3,200 orders, averaging 125,000,000 ÷ 3,200 ≈ 39,100 VND per order. October had 3,000 orders, averaging 120,000,000 ÷ 3,000 = 40,000 VND per order. So each order was actually slightly larger; revenue fell because there were 200 fewer orders. Note: the average is easily pulled up by a few large wholesale orders, so also check the median (the middle value when orders are sorted from smallest to largest) before concluding.
Step 3: find the cause, and be careful with conclusions
Drinks fell by 6 million, more than the overall drop of 5 million (the other categories together rose by 1 million: +1 + 2 − 2). Two hypotheses: Hanoi's weather turned cold, so fewer people bought cold drinks, and a new convenience store opened 200 m away. Looking day by day shows orders fell evenly across the month rather than after the other store's opening day — so the weather looks like the main reason. But this is still correlation, not proof of cause; it needs watching next month.
Step 4: recommend actions
- Cut cold soft-drink orders by about 15% for November to avoid leftover stock.
- Put hot milk drinks, tea and instant coffee where the soft-drink fridge display was.
- Set indicators to track: orders per day and drinks revenue; review after 4 weeks.
A 6-month plan for beginners
This plan assumes 15 hours a week (about 2 hours each weekday evening and 5 hours at the weekend), 26 weeks in total. Studying full time is faster, but do not skip any stage.
| Month | What you learn | Weeks | Hours | Done when you can |
|---|---|---|---|---|
| 1 | Analytical thinking, basic statistics, Excel basics | 4 | 60 | Calculate mean and median, and write 5 measurable business questions |
| 2 | Advanced Excel and Google Sheets | 4 | 60 | Build Pivot Tables, use XLOOKUP, clean a 10,000-row sales file |
| 3 | SQL | 5 | 75 | Write GROUP BY and JOIN queries and check that totals match |
| 4 | Python pandas | 5 | 75 | Merge several files, handle missing data, draw quick charts |
| 5 | Dashboards and data storytelling | 4 | 60 | Build a one-page dashboard and give a 5-minute presentation |
| 6 | Real project, CV, practice tests | 4 | 60 | Publish a project on GitHub and send at least 20 applications |
| Total | 26 | 390 |
Check: 4 + 4 + 5 + 5 + 4 + 4 = 26 weeks; 60 + 60 + 75 + 75 + 60 + 60 = 390 hours, exactly 26 × 15. SQL and Python get more weeks because they are what employers test most closely.
Where to learn, and what it costs
Self-study with free materials and an online course with exercises costs about 0–5 million VND; a training-centre course with a mentor about 8–30 million VND (2026 reference in Vietnam, varies by provider). A computer with 8 GB of RAM or more is enough. What you cannot do without is real data to practise on: public datasets or sales data with personal information removed.
Data analyst salaries in 2026 and who is hiring
The 2026 market has real demand, but competition at fresher level is fairly high. AI tools make writing SQL and summarising data faster, so employers favour people who understand the business, ask the right questions and can verify results — not just people who can click through a tool.
| Level | Typical experience | Reference salary, 2026 (million VND/month) |
|---|---|---|
| Intern | Studying or just finished | 3–6 |
| Fresher, reporting specialist | 0–1 year | 9–14 |
| Data analyst | 1–3 years | 15–25 |
| Experienced data analyst | 3–5 years | 25–35 |
These are 2026 reference ranges in Vietnam that depend on region (Hanoi and Ho Chi Minh City are usually higher), industry and English level; they are not a promise.
Industries that hire the most
- Banking, finance, insurance: risk reports, customer analysis, credit cards.
- Retail and e-commerce: sales, inventory, promotions, shopping behaviour.
- Logistics and supply chain: delivery times, shipping costs, routes.
- Marketing, agencies, tech companies: ad performance, conversion funnels, user retention.
How to get called for interviews
One complete analysis project (question, data, SQL, dashboard, 3 recommendations) on GitHub is worth far more than a pile of certificates. If you already work in an industry (sales, accounting, warehousing), choose a project in that industry: understanding the business is a career changer's biggest advantage.
A note on personal data: customer data (names, phone numbers, addresses, purchase history) is information protected by Vietnamese law. Do not take your company's real data outside to build a portfolio, do not paste customer data into public AI tools, and only pull the columns you need for the analysis. Specific rules can change — read the current official regulations on personal data protection and your company's own policy.
Common beginner mistakes
Learning tools before learning to ask questions
Symptom: a beautiful dashboard, but no answer when the boss asks "so what should we do?". Cause: skipping analytical thinking. Fix: before every exercise, write down one measurable business question, such as "which category made October revenue fall?".
Not checking totals
Symptom: total revenue in your report does not match the accounting software. Cause: a wrong JOIN that duplicates rows, or a date filter that drops the last day of the month. Fix: always reconcile totals against another source, as in the example above.
Confusing correlation with causation
Symptom: concluding "ads made revenue grow" just because both rose during the Tet (Lunar New Year) month. Cause: ignoring seasonality. Fix: compare with the same period last year, or compare groups with and without ads.
Frequently asked questions
Does a data analyst need to be good at maths?
You need basic statistics: mean, median, percentages, distributions and correlation. You do not need the advanced maths a data scientist uses. Being careful with numbers and double-checking matters more.
Can I become a data analyst from an unrelated field?
Yes. Quite a few people move over from accounting, sales, marketing or logistics thanks to their business knowledge. You need about 6 months of steady study and a project in the field you used to work in.
Should I learn Power BI or Looker Studio?
Check job ads where you want to work: companies on Microsoft usually ask for Power BI; companies using Google Workspace or digital advertising often use Looker Studio. Dashboard design principles are the same, so moving from one to the other is quick.
Will AI replace data analysts?
AI speeds up writing queries and summarising tables, but it does not know which data is wrong, which questions are worth asking or which recommendations are realistic for the business. People who use AI to work faster gain an edge; people who only produce repetitive reports face more risk.
Exercise: analyse a sales table yourself
- Rebuild Ms Hanh's revenue table in Excel, using formulas to calculate the change, % change and share.
- Read the sample SQL query and write in words what each line does; modify it to get September revenue.
- Write 3 measurable business questions for a shop you know (a coffee shop, a pharmacy, an online store).
- Plan your own 6 months using the real hours you have each week; total the weeks and hours.
Self-assessment criteria
- Pass: your Excel table calculates totals of 125 and 120, a change of −5, and shares that add up to 100%.
- Pass: you can explain why filtering "before 1 November" is safer than "up to 31 October".
- Pass: you can distinguish a data analyst from a data scientist and a data engineer in one sentence each.
- Not yet: you typed results by hand instead of using formulas, totals do not match, or you state a cause without saying how to verify it.
This lesson belongs to the first step of the roadmap — Analytical thinking & basic statistics. Once you can ask measurable questions and read means and medians correctly, the next step is Advanced Excel & Google Sheets: Pivot Tables, XLOOKUP and data cleaning. See the 8-step data analyst roadmap.